Service health
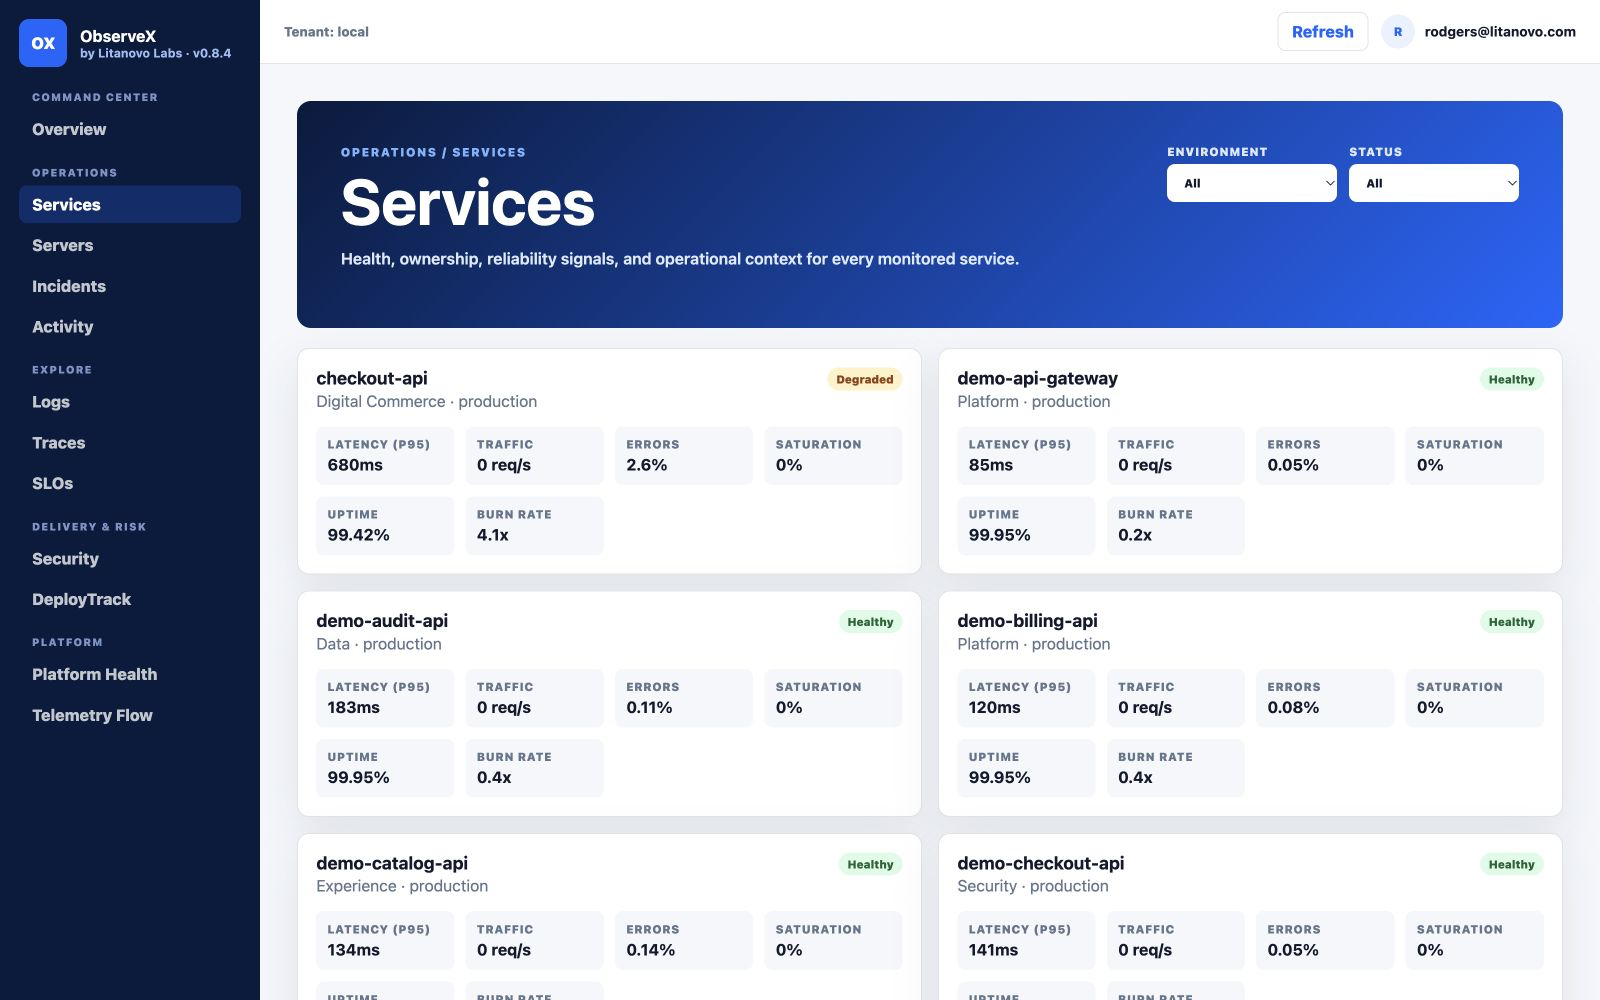
Latency, error rate, uptime, burn rate, ownership and environment health in one place.
Operational intelligence Private preview live
ObserveX brings service health, metrics, logs, traces, incidents, SLOs, security posture and DeployTrack release evidence into one cloud-native operational view.
Product capabilities
ObserveX is available for guided demonstrations and controlled private-preview access for engineering teams, technology partners and prospective customers.
Latency, error rate, uptime, burn rate, ownership and environment health in one place.
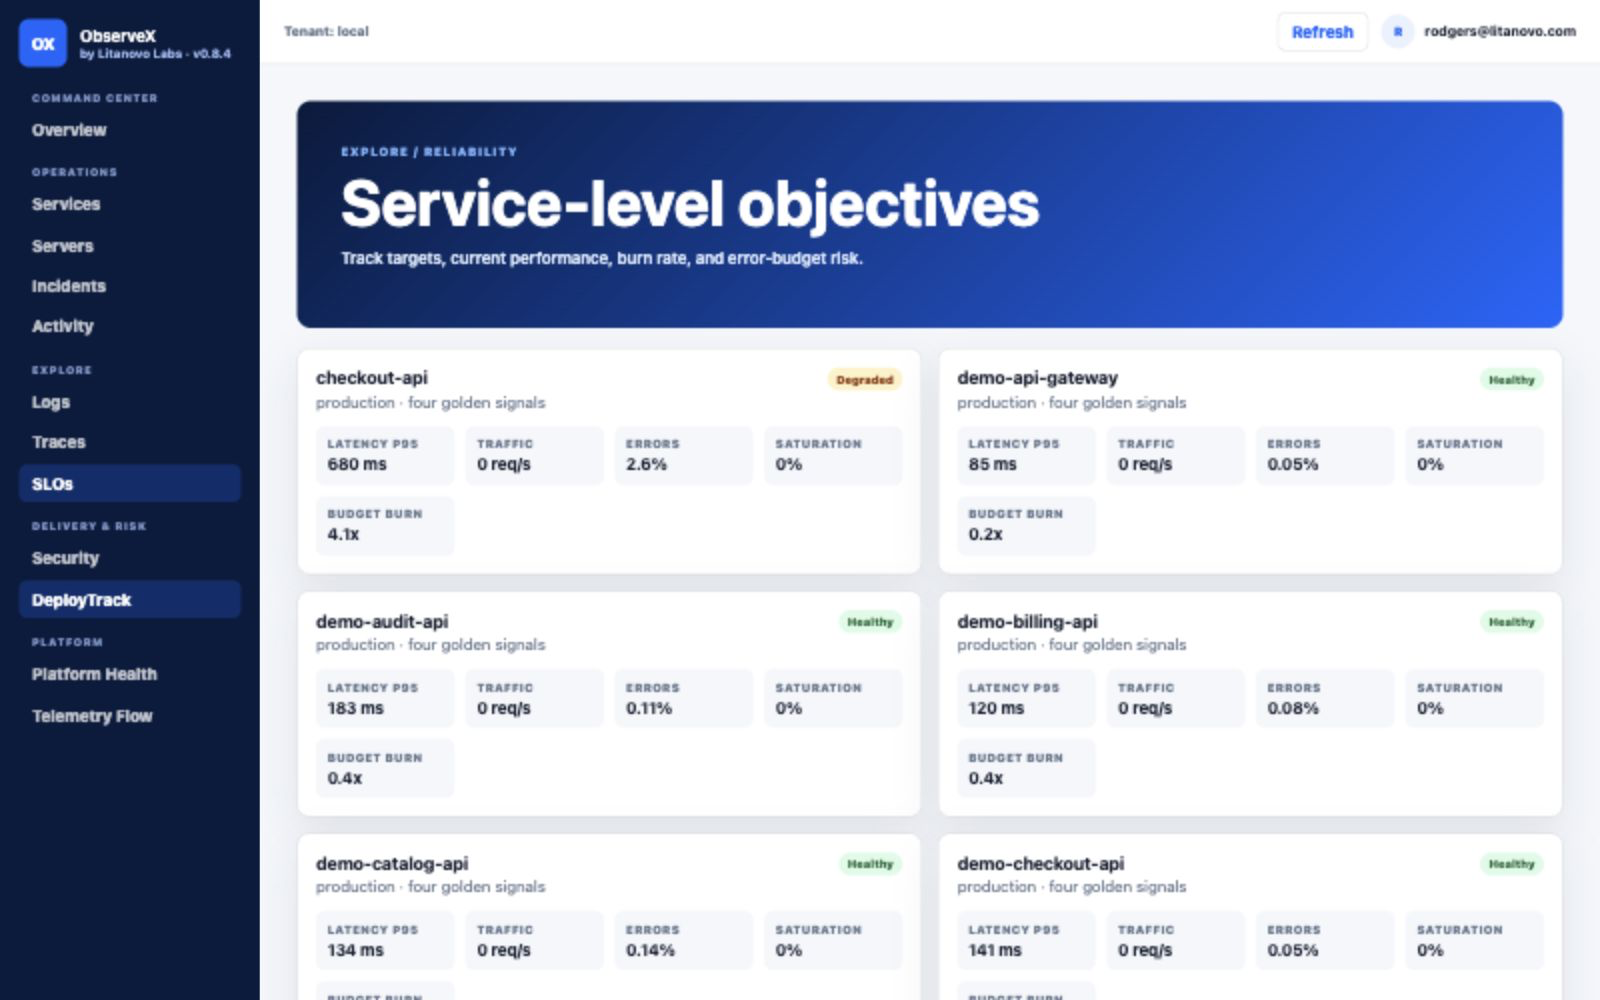
OpenTelemetry-aligned navigation across Prometheus metrics, Loki logs and Tempo traces.
Acknowledge, resolve and audit response actions with clear operator context.
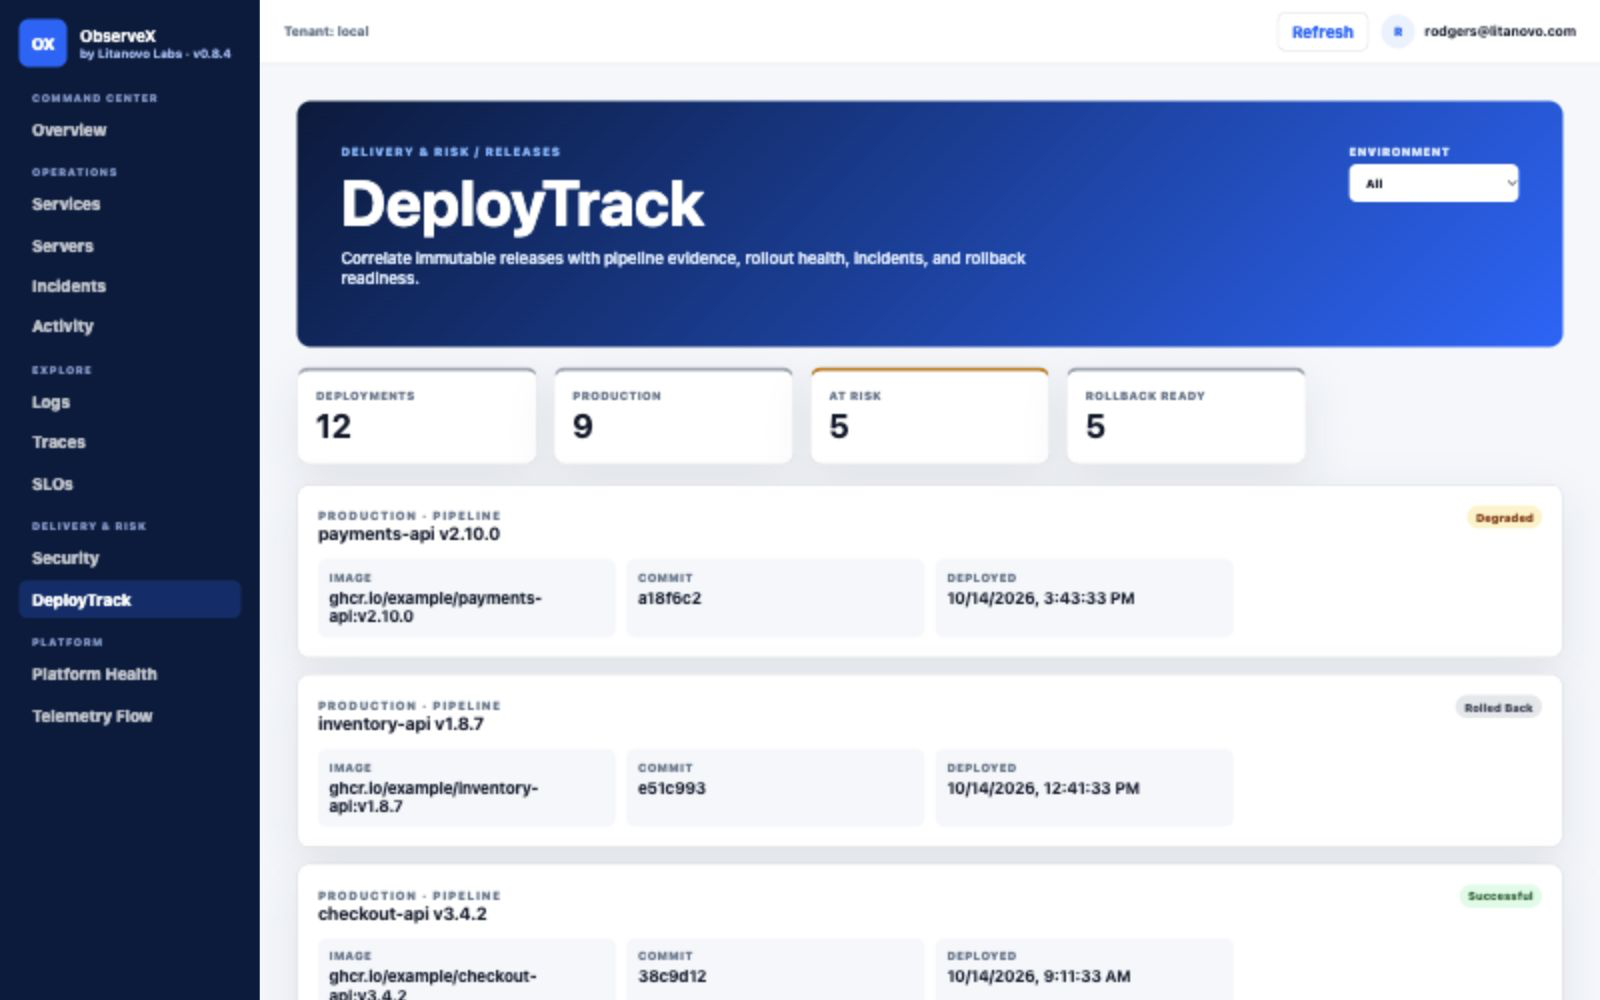
Connect releases, commits, ownership, rollout status, risk and rollback readiness.
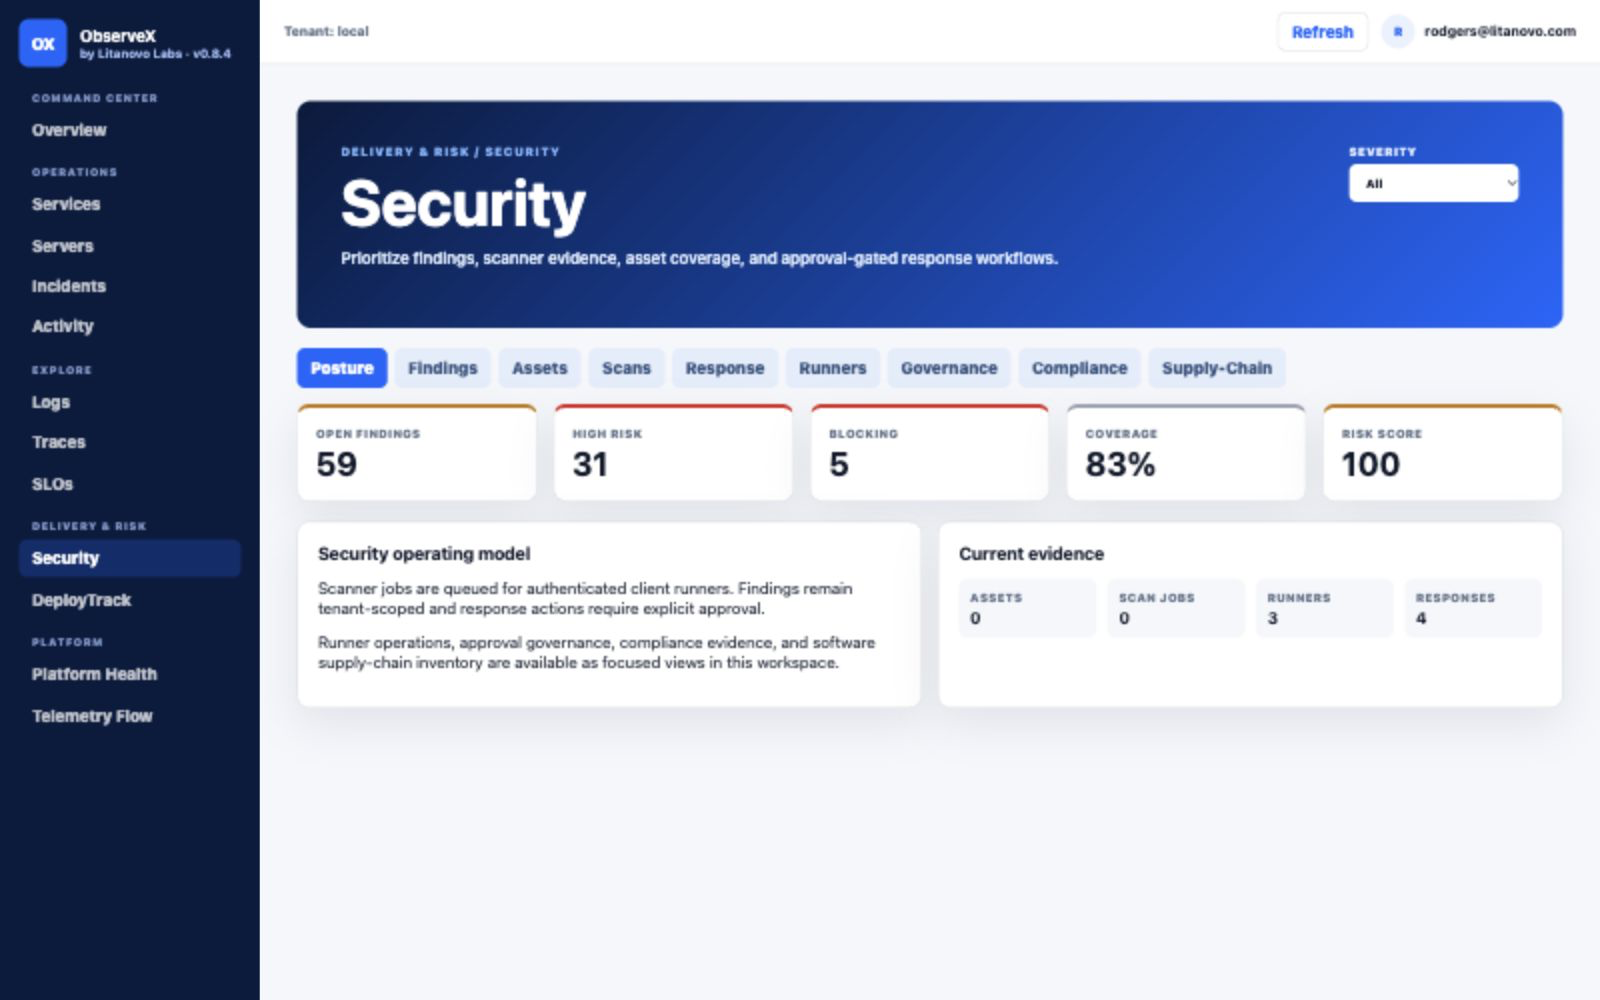
Bring findings, coverage and remediation workflow into the wider operational view.
Keycloak-backed SSO, role-based access and tenant isolation protect operational data and controls.
Private preview
The live platform is protected by SSO. Preview access is issued individually so every visitor receives the right level of visibility.
Explore the current workspaces below and see how reliability, security and delivery evidence connect.
View product screens ↓See the ObserveX operator workflow in action without requiring credentials or access to the live platform.
Watch Demo ↗Tell us about your environment and we will arrange a walkthrough or suitable preview account.
Request access →Product preview
Explore focused workspaces for service operations, reliability, security, delivery intelligence and platform health.

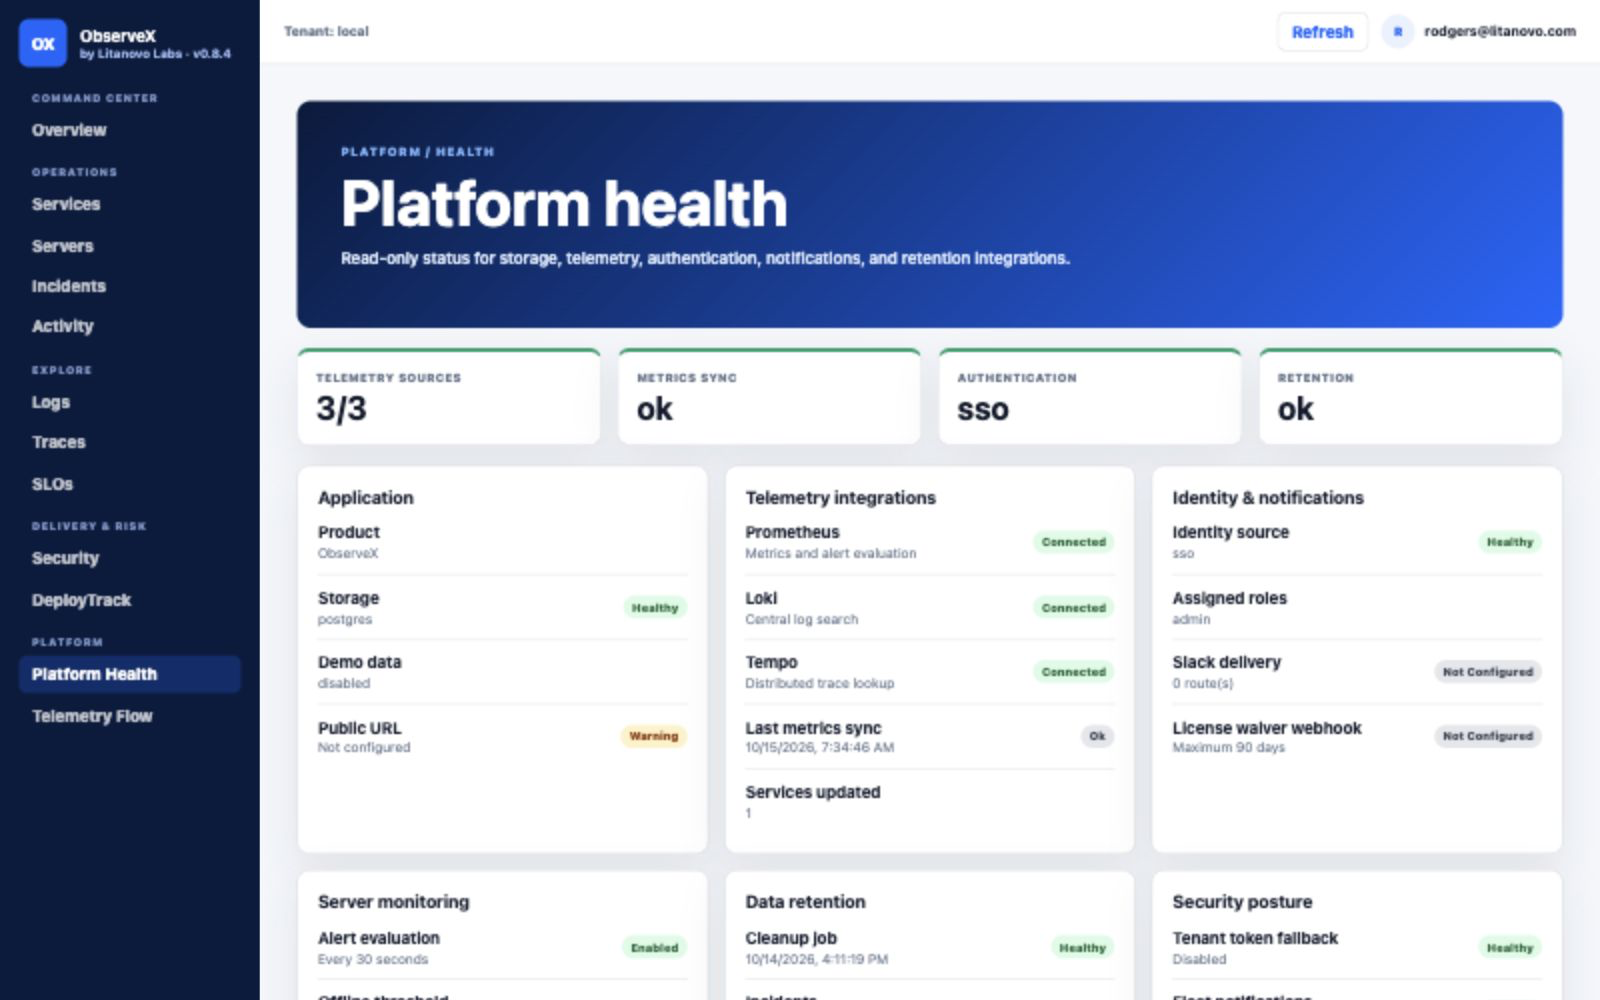
Watch the product demo or request a guided walkthrough tailored to your environment.